Anthropogenic emissions
Following up from our post on natural emissions last week this week we turn our attention to the anthropogenic sources. As with natural emissions there is variance just as to the current level of anthropogenic emissions but most figures cite a figure of about 330 Tg/year for 2005 with papers using a more recent reference year being tending to be slightly higher. An extract from the IPCC's AR5 report is shown below:

The paper states:

Anthropogenic methane emissions
Climate Change 2013: The Physical Science Basis. Contribution of Working Group I to the Fifth Assessment Report of the Intergovernmental Panel on Climate Change
The paper states:
"Anthropogenic CH4 sources are estimated to range between 50% and 65% of the global emissions for the 2000s ... Anthropogenic sources are dominant over natural sources in top-down inversions (~65%) but they are of the same magnitude in bottom-up models and inventories"
This surpassing, or at least equalling in the magnitude of anthropogenic emissions compared to natural emissions is due to the continued growth of emissions in certain sectors in the decades leading up to the turn of the new millennium:

Trends in global emissions of methane (1970-2005)
Source: Emissions Database for Global Atmospheric Research
Significant increases in methane emissions from 'waste' and from 'fugitive emissions from fuel' (which includes the significant component of leaked methane from the production of fossil fuels) were mainly responsible for the continued growth of anthropogenic methane emissions in the last 3 decades of the 20th century. Since 2000 "emissions started increasing again, with
an average growth rate of 1.9% per year, which has
meant that since 2002, the emissions increased faster
than in the last four decades. This led to a global increase of about 20% over the period 2000-2010,
driven by increased coal mining by the top methane emitting country China (+50%) and increased cattle
numbers in Brazil (+23%)" (IEA, 2012).
The result of these changes since 2000 mean as of 2010 the make-up of anthropogenic emissions is as follows:

Break down of anthropogenic CH4 emissions, 2010
Source: International Energy Agency, available here
Another interesting way to interrogate anthropogenic sources of methane is geographically - by mapping its emission such as shown here in another graphic by EDGAR (Emissions Database for Global Atmospheric Research):
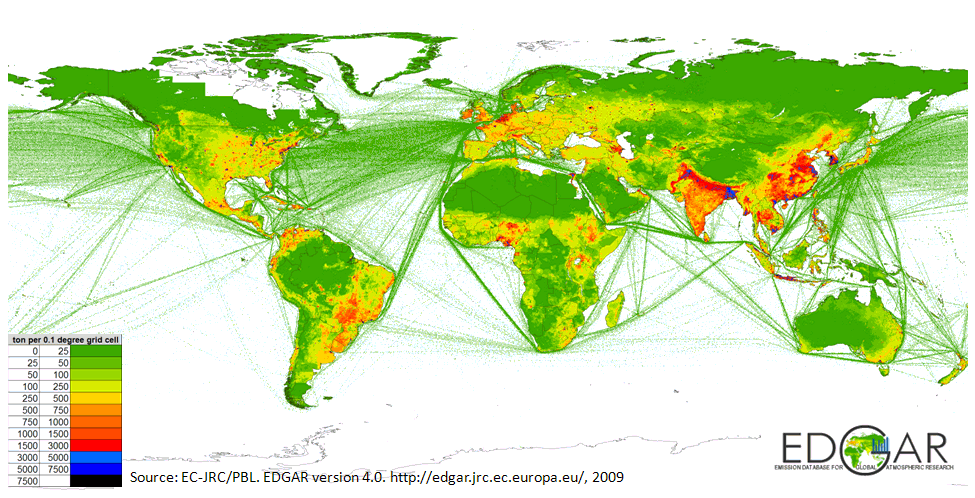
Mapped anthropogenic methane emissions, 2009
EDGAR, 2009
The blue shading shown in West Bengal and Bangladesh depict the particularly intense 3000-5000 tonnes CH4 emitted per 0.1degree grid cell per year with parts of China being shown to emit 5000 tonnes and above due in part to their intensive coal mining practices and rice agriculture.
So in summary of this week's post we have learnt:
- Anthropogenic methane emissions are at present thought to be approximately 350Tg/year
- This level of emission is at least equal, if not larger than the sum of all natural methane emissions
- Between 2000 and 2010 anthropogenic methane emissions increased by 20%
- Responsible for 43% of methane emissions agriculture is the largest source of anthropogenic methane which we will look into in more detail next week
Any questions or comments please don't hesitate to comment below!
Till next time...
References:
Ciais, P., C. Sabine, G. Bala, L. Bopp, V. Brovkin, J. Canadell, A. Chhabra, R. DeFries, J. Galloway, M. Heimann, C.
Jones, C. Le Quéré, R.B. Myneni, S. Piao and P. Thornton, 2013: Carbon and Other Biogeochemical Cycles. In: Cli-
mate Change 2013: The Physical Science Basis. Contribution of Working Group I to the Fifth Assessment Report
of the Intergovernmental Panel on Climate Change [Stocker, T.F., D. Qin, G.-K. Plattner, M. Tignor, S.K. Allen, J.
Boschung, A. Nauels, Y. Xia, V. Bex and P.M. Midgley (eds.)]. Cambridge University Press, Cambridge, United
Kingdom and New York, NY, USA.
International Energy Agency, I. (2012). PART III: GREENHOUSE-GAS EMISSIONS. [online] Emissions Database for Global Atmospheric Research. Available at: http://edgar.jrc.ec.europa.eu/docs/IEA_PARTIII.pdf [Accessed 04 Dec. 2015].
I love that anthropogenic methane graphic at the end! Human impact is obviously significant, are there any means of improving sinks?
ReplyDelete